⏱️ RC Capacitor Charge/Discharge
Watch a capacitor charge and discharge in real time on your Serial Plotter — see the exponential curve that defines electronic timing.
Overview
The RC (Resistor-Capacitor) circuit is one of the most fundamental building blocks in electronics. It defines timing, filtering, and waveform shaping. Understanding it is essential for designing oscillators, power supplies, and audio filters.
Technical Insight: When a capacitor charges through a resistor, the voltage follows: V(t) = V_s × (1 − e^(−t/τ)), where τ = R × C (the time constant). After 1τ, the capacitor is 63.2% charged. After 5τ, it is 99.3% charged. During discharge: V(t) = V_0 × e^(−t/τ). Arduino samples this curve on its ADC, plotting the exact exponential you learned in textbooks.
In simple terms: When you fill a bottle (capacitor) through a straw (resistor), it fills fast at first but slows down as it gets full. The Arduino watches and records this 'filling' behavior at 50 samples per second.
What you'll learn: RC time constant calculation (τ = RC), exponential charge/discharge curves, Arduino Serial Plotter usage, capacitor behavior, and analog voltage measurement.
Estimated time: 25-35 minutes. Difficulty: ⭐ Beginner-friendly — perfect for physics and EE coursework.
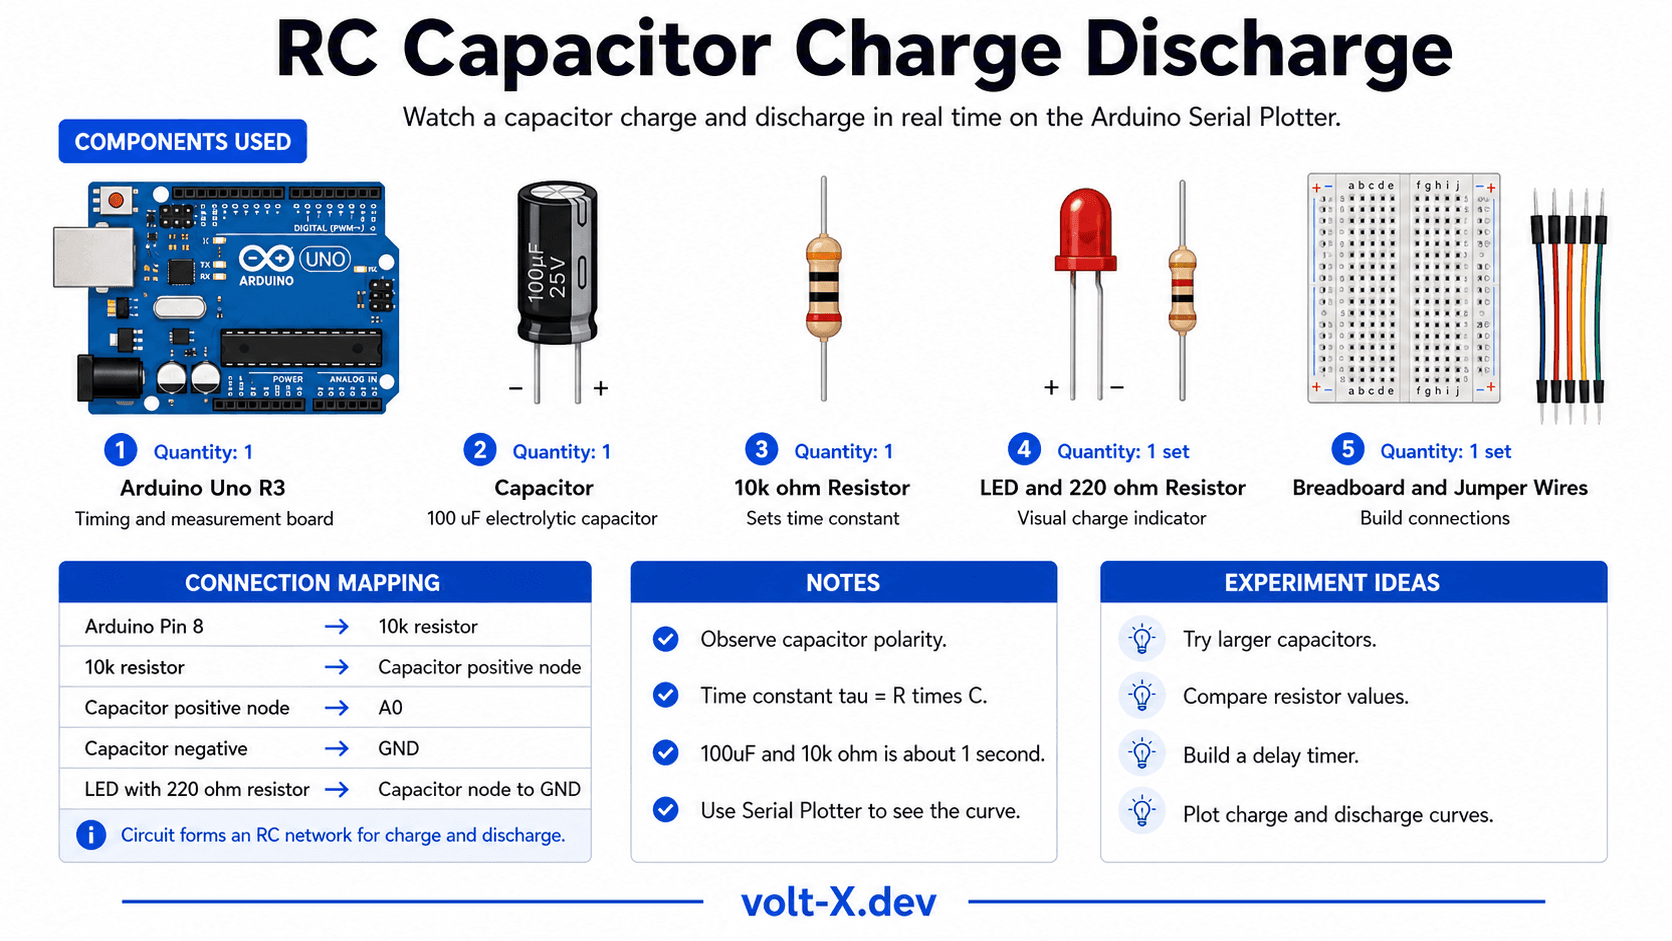
Components Needed
| Component | Specification | Qty | Notes |
|---|---|---|---|
| Arduino Uno R3 | 5V | 1 | |
| Capacitor | 100µF, 16V electrolytic | 1 | Observe polarity! |
| Resistor | 10kΩ | 1 | Sets time constant: τ = 10kΩ × 100µF = 1s |
| LED + Resistor | 220Ω | 1 | Visual charge indicator |
| Jumper Wires | M-M | 8 | |
| Breadboard | Half-size | 1 |
Component Pin Mapping
Step-by-Step Tutorial
Build the RC Circuit
Add LED Indicator
Upload and Open Serial Plotter
Calculate τ
Experiment
Arduino Code
// RC Circuit Charge/Discharge Demo — Volt X
// Charge: pin 8 HIGH. Discharge: pin 8 LOW
// View in Tools > Serial Plotter for the exponential curve!

const int CHARGE_PIN = 8;
const int SENSE_PIN  = A0;
const int CHARGE_TIME = 5000; // ms — ~5 time constants
const int DISCHARGE_TIME = 5000;

void setup() {
  pinMode(CHARGE_PIN, OUTPUT);
  Serial.begin(9600);
}

void samplePhase(bool charging, unsigned long duration) {
  digitalWrite(CHARGE_PIN, charging ? HIGH : LOW);
  unsigned long start = millis();
  while (millis() - start < duration) {
    float voltage = analogRead(SENSE_PIN) * (5.0 / 1023.0);
    Serial.println(voltage); // For Serial Plotter
    delay(20); // 50 samples/second
  }
}

void loop() {Reviews & Ratings
Sign in to leave a review
Loading reviews...