📊 Analog LED Bar Graph Display
Map any analog sensor value to a 10-LED bar graph — build a visual voltmeter, audio meter, or fuel gauge for your projects.
Overview
An LED bar graph display converts a numeric value into a visual level indicator. It's the classic 'fuel gauge' or 'battery indicator' in electronics. You can map any sensor — potentiometer, LDR, temperature, microphone — to this display.
Technical Insight: We use map() to scale the ADC range (0–1023) to 0–10 LEDs. For each level, we turn on all LEDs from 1 up to that level (bargraph mode) OR only that specific LED (dot mode). The LM3914 chip does this in hardware, but this project teaches the software equivalent with full flexibility.
In simple terms: Think of it as a thermometer made of LEDs instead of mercury. The higher the sensor reading, the more LEDs fill up from bottom to top — a number converted to a visual length.
What you'll learn: Multi-LED sequencing, map() and constrain(), bar vs dot display modes, sensor-agnostic visualization, and practical UI design for embedded systems.
Estimated time: 35-45 minutes. Difficulty: ⭐ Beginner-friendly.
Components Needed
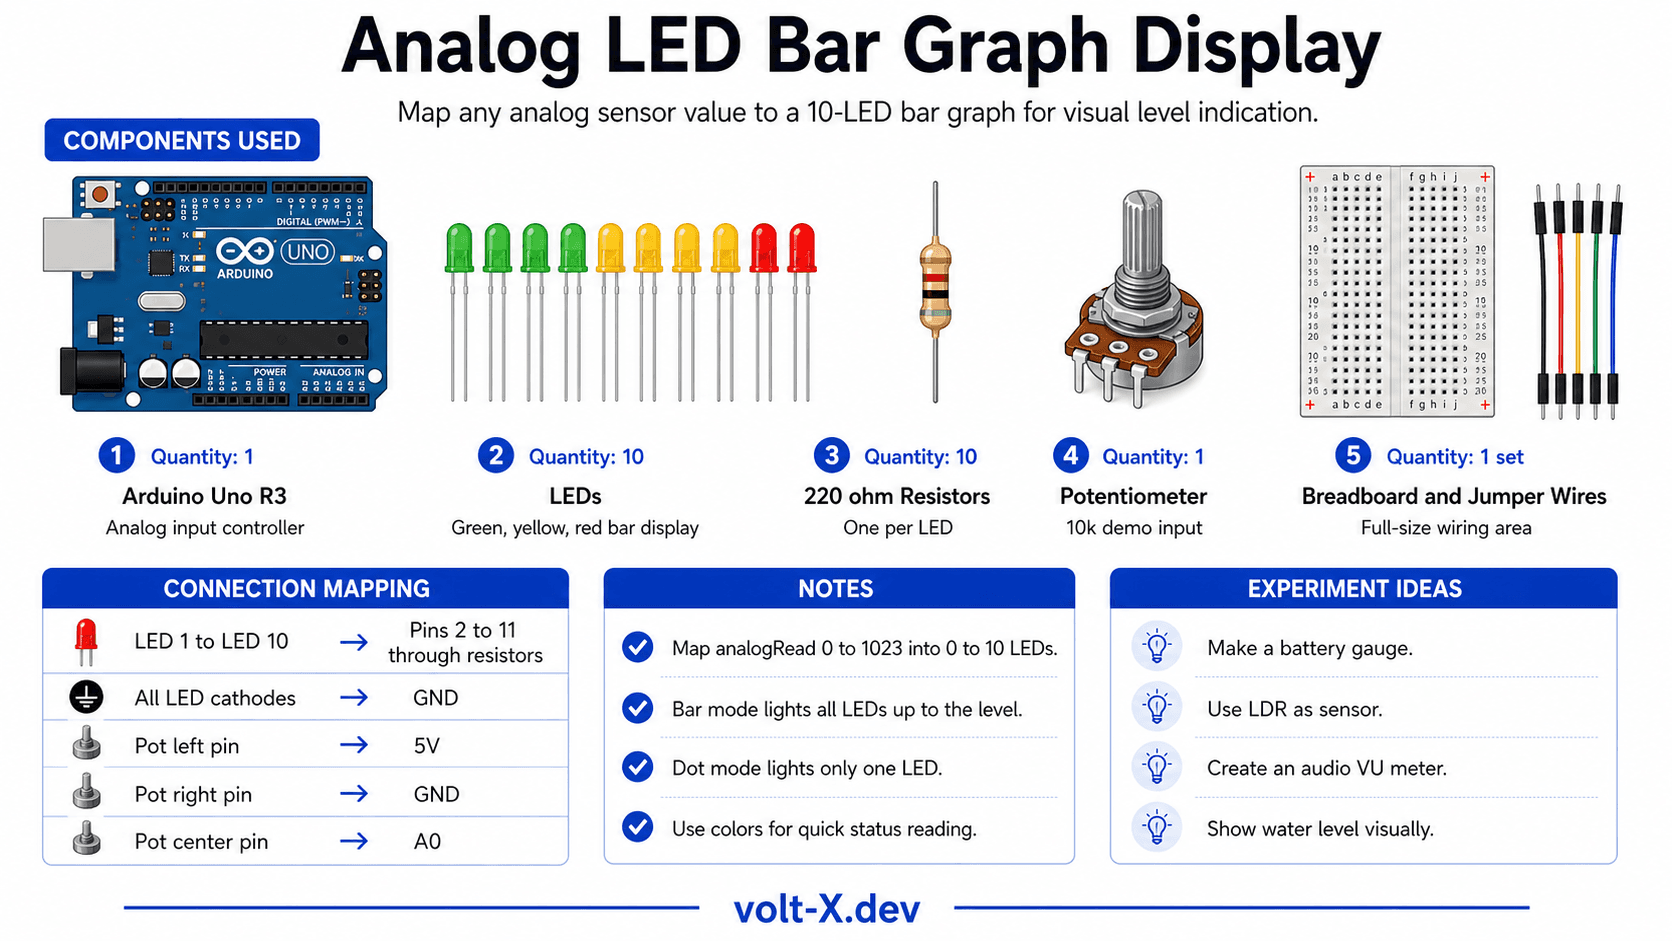
| Component | Specification | Qty | Notes |
|---|---|---|---|
| Arduino Uno R3 | 5V | 1 | |
| LEDs | 5mm — Green, Yellow, Red mix | 10 | 5G + 3Y + 2R for visual flair |
| Resistors | 220Ω | 10 | One per LED |
| Potentiometer | 10kΩ | 1 | Demo input — swap for any sensor |
| Breadboard + Wires | Full-size | 1 |
Component Pin Mapping
Step-by-Step Tutorial
Place 10 LEDs in a Row
Wire Anodes to Arduino
Wire the Potentiometer
Upload and Turn the Knob
Swap Input Sensor
Arduino Code
// LED Bar Graph Display — Volt X
// 10 LEDs on pins 2-11, potentiometer on A0

const int NUM_LEDS  = 10;
const int LED_PINS[NUM_LEDS] = {2,3,4,5,6,7,8,9,10,11};
const int SENSE_PIN = A0;

void setup() {
  for (int i = 0; i < NUM_LEDS; i++)
    pinMode(LED_PINS[i], OUTPUT);
  Serial.begin(9600);
}

void showBar(int level) {
  // BAR MODE: light all LEDs from 0 up to level
  for (int i = 0; i < NUM_LEDS; i++)
    digitalWrite(LED_PINS[i], i < level ? HIGH : LOW);
}

void loop() {
  int raw   = analogRead(SENSE_PIN);          // 0-1023
  int level = map(raw, 0, 1023, 0, NUM_LEDS); // 0-10
  level = constrain(level, 0, NUM_LEDS);

showBar(level);Reviews & Ratings
Sign in to leave a review
Loading reviews...